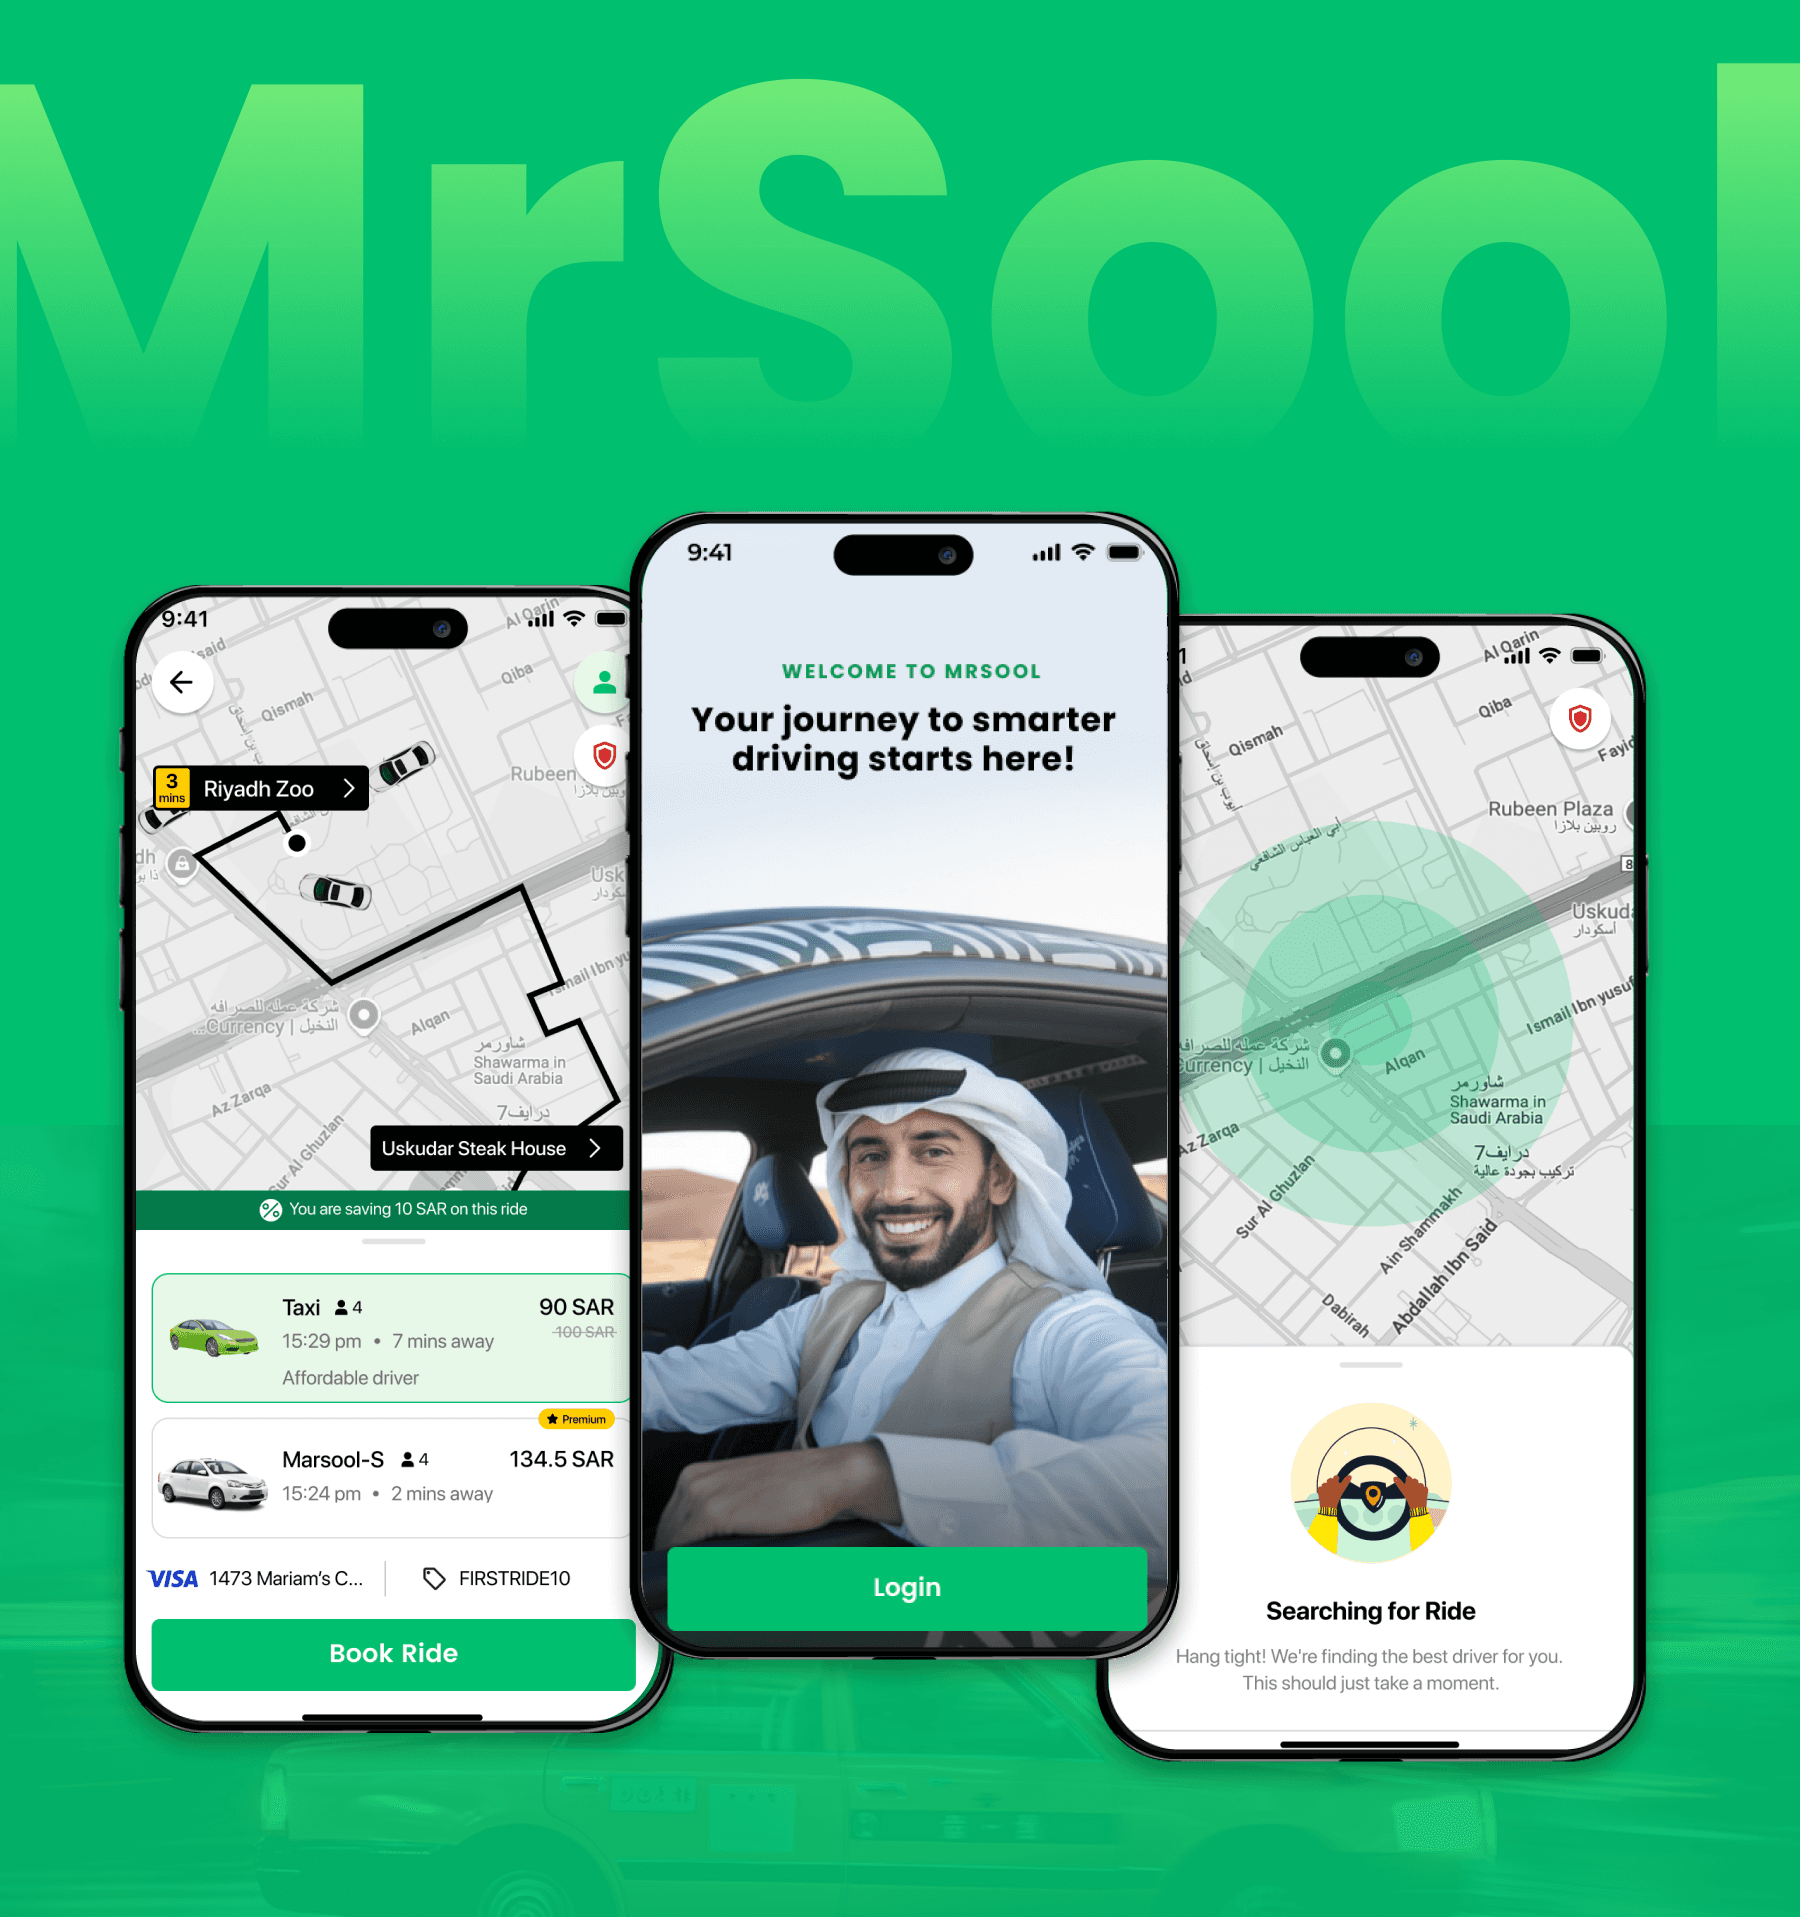
WheelsEye is a fleet management platform in India offering telematics solutions like - GPS tracking, advanced Pro features, diesel monitoring and many more. It serves fleet owners seeking operational visibility, fuel control, and compliance management at scale - shifting manual operations to digital fleet intelligence.
Understand the current NPS pattern, freeze the trigger points, develop content that user understood and redesign UI where required.
48.2%
↑ from 37%
Overall NPS score
26,890
Responses collected
61%
Promoters overall
CONTEXT
Wheelseye has 400,000+ users across GPS, Diesel Sensor, and FASTag. The team was collecting NPS, but the data wasn't reliable enough to act on.
Surveys went out at random times, asked the same questions to everyone, and gave users feedback options that didn't match their actual problems. Teams couldn't use the data to make decisions.
🚨
The problem wasn't that users weren't giving feedback. It was that we weren't asking in a way that made the feedback actionable (wrong questions at wrong time to wrong users)
BEFORE
Same survey for all new or old users
Only product level NPS and no overall NPS.
Feedback options were too generic to be useful and match pain point
Surveys fired even when vehicles were offline.
DESIGN GOALS
Different surveys for new vs long-term users
Contextual options per product and user stage
90-day gap between surveys
Trigger at high-intent moments to improve collection rate
RESEARCH
Looking at the data before opening Figma
I worked with the analyst to understand few key data's points before getting to solution. This gave me a foundation to design from instead of making assumptions.
→ Study the current NPS ratings and percentage
→ Identify where NPS can be triggered
→ Group user types (New/mature)
Current NPS Charts
Studied the existing NPS data to understand the baseline. Across all users, 61% were promoters, 14% were passives, and 24% were detractors. But the more useful part was the open responses : GPS accuracy, technician issues, and recharge costs kept coming up.
This told us the feedback options had to be specific enough to capture real problems and just not generic bucketing of issues.
User Segmentation
We then grouped users by how long they had been on the platform. This turned out to be an important insight. New users (0-90 days) and older users (90+ days) had fundamentally different experiences and therefore, very different things to complain about or appreciate.
NEW USERS (0-90 DAYS)
Installation pain dominated
Bad install experience, installers arriving late or not at all, and slow support were the top detractor drivers. App confusion was secondary.
OLD USERS (90+DAYS)
Product & reliability gaps
Unresolved tickets, GPS inaccuracy, inconsistent features, and pricing relative to value were the core complaints.
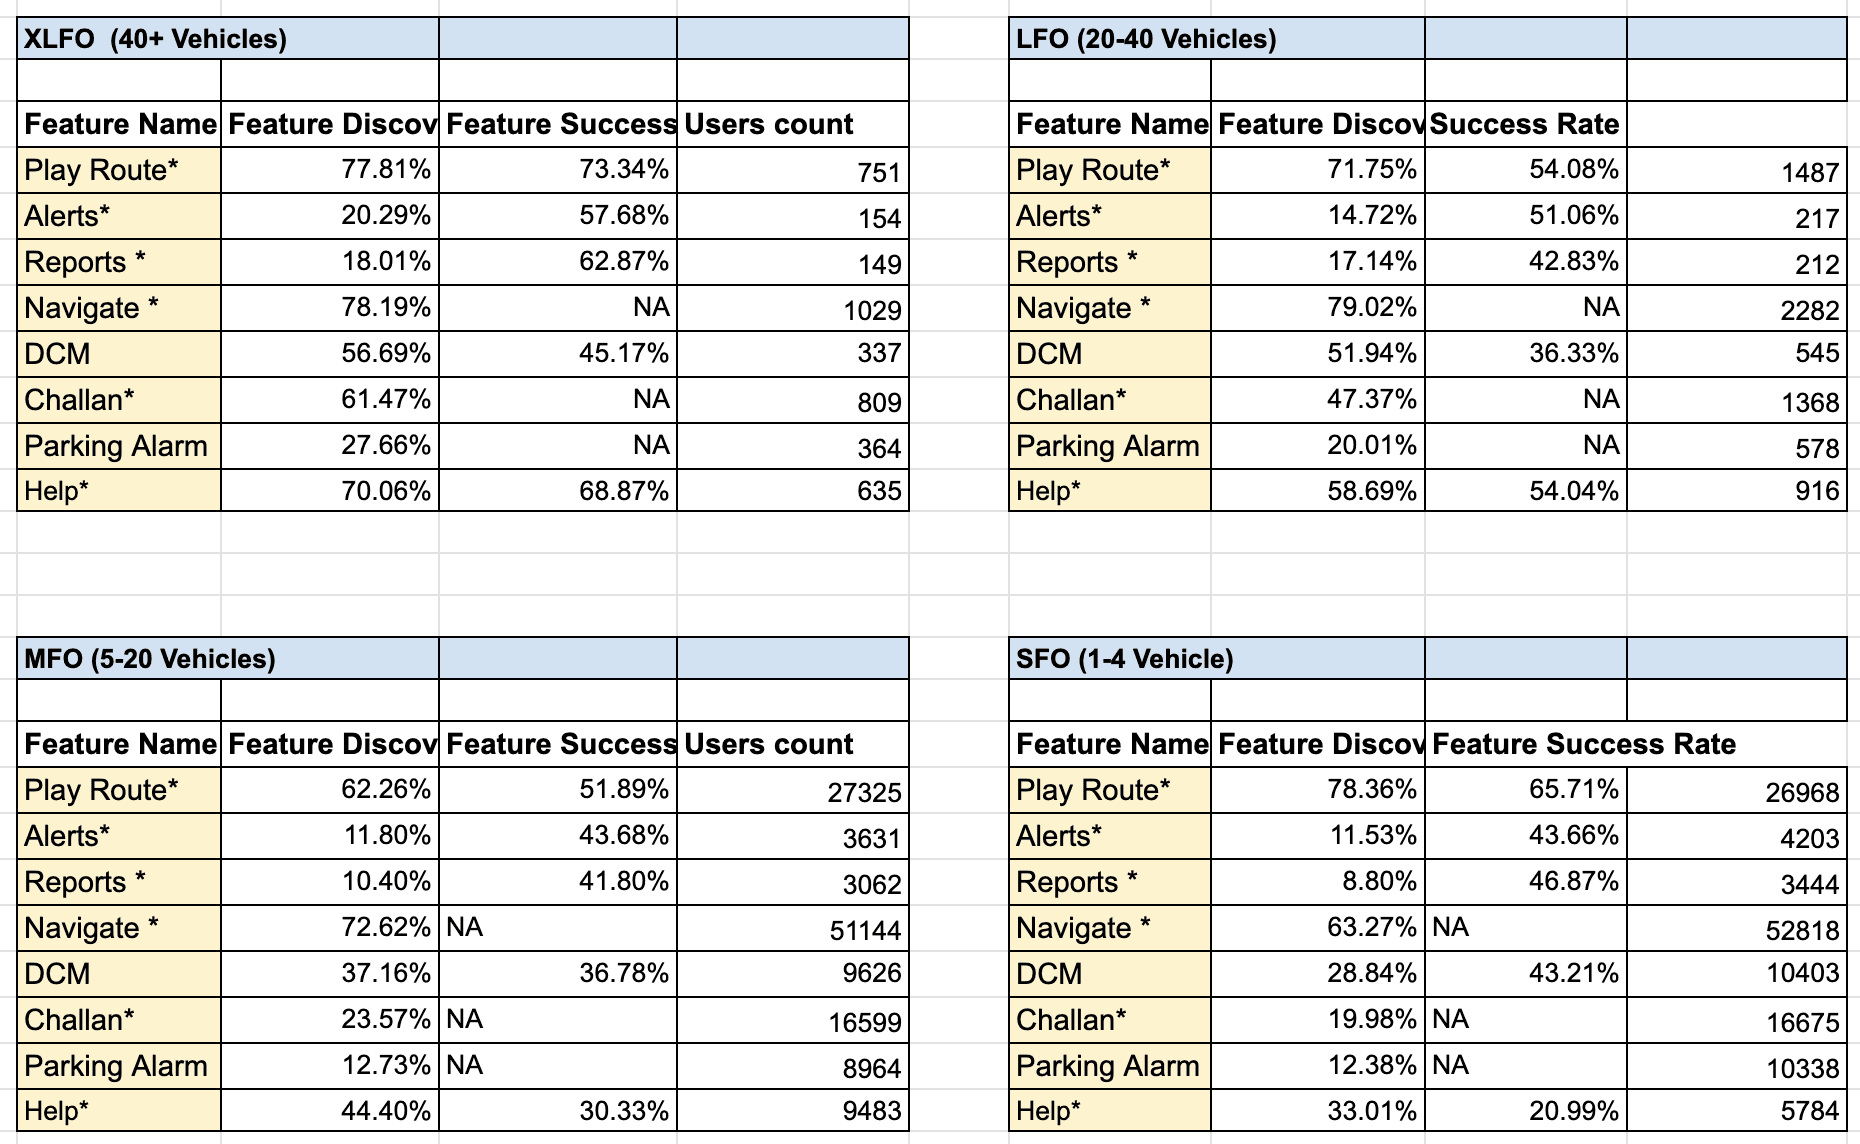
Identify most used features on the app
The next thing I needed to figure out was where in the app to show the survey. Timing matters a lot with NPS - if you catch someone mid-task or at a frustrating moment, the response is going to be skewed.
So I looked at feature discovery and success rates across different fleet sizes (SFO - XLFO) to find where users were most active and most likely to be in a good headspace to respond to give honest feedback.
That's what helped finalize where the survey triggers would sit.
DESIGN
What was designed and why
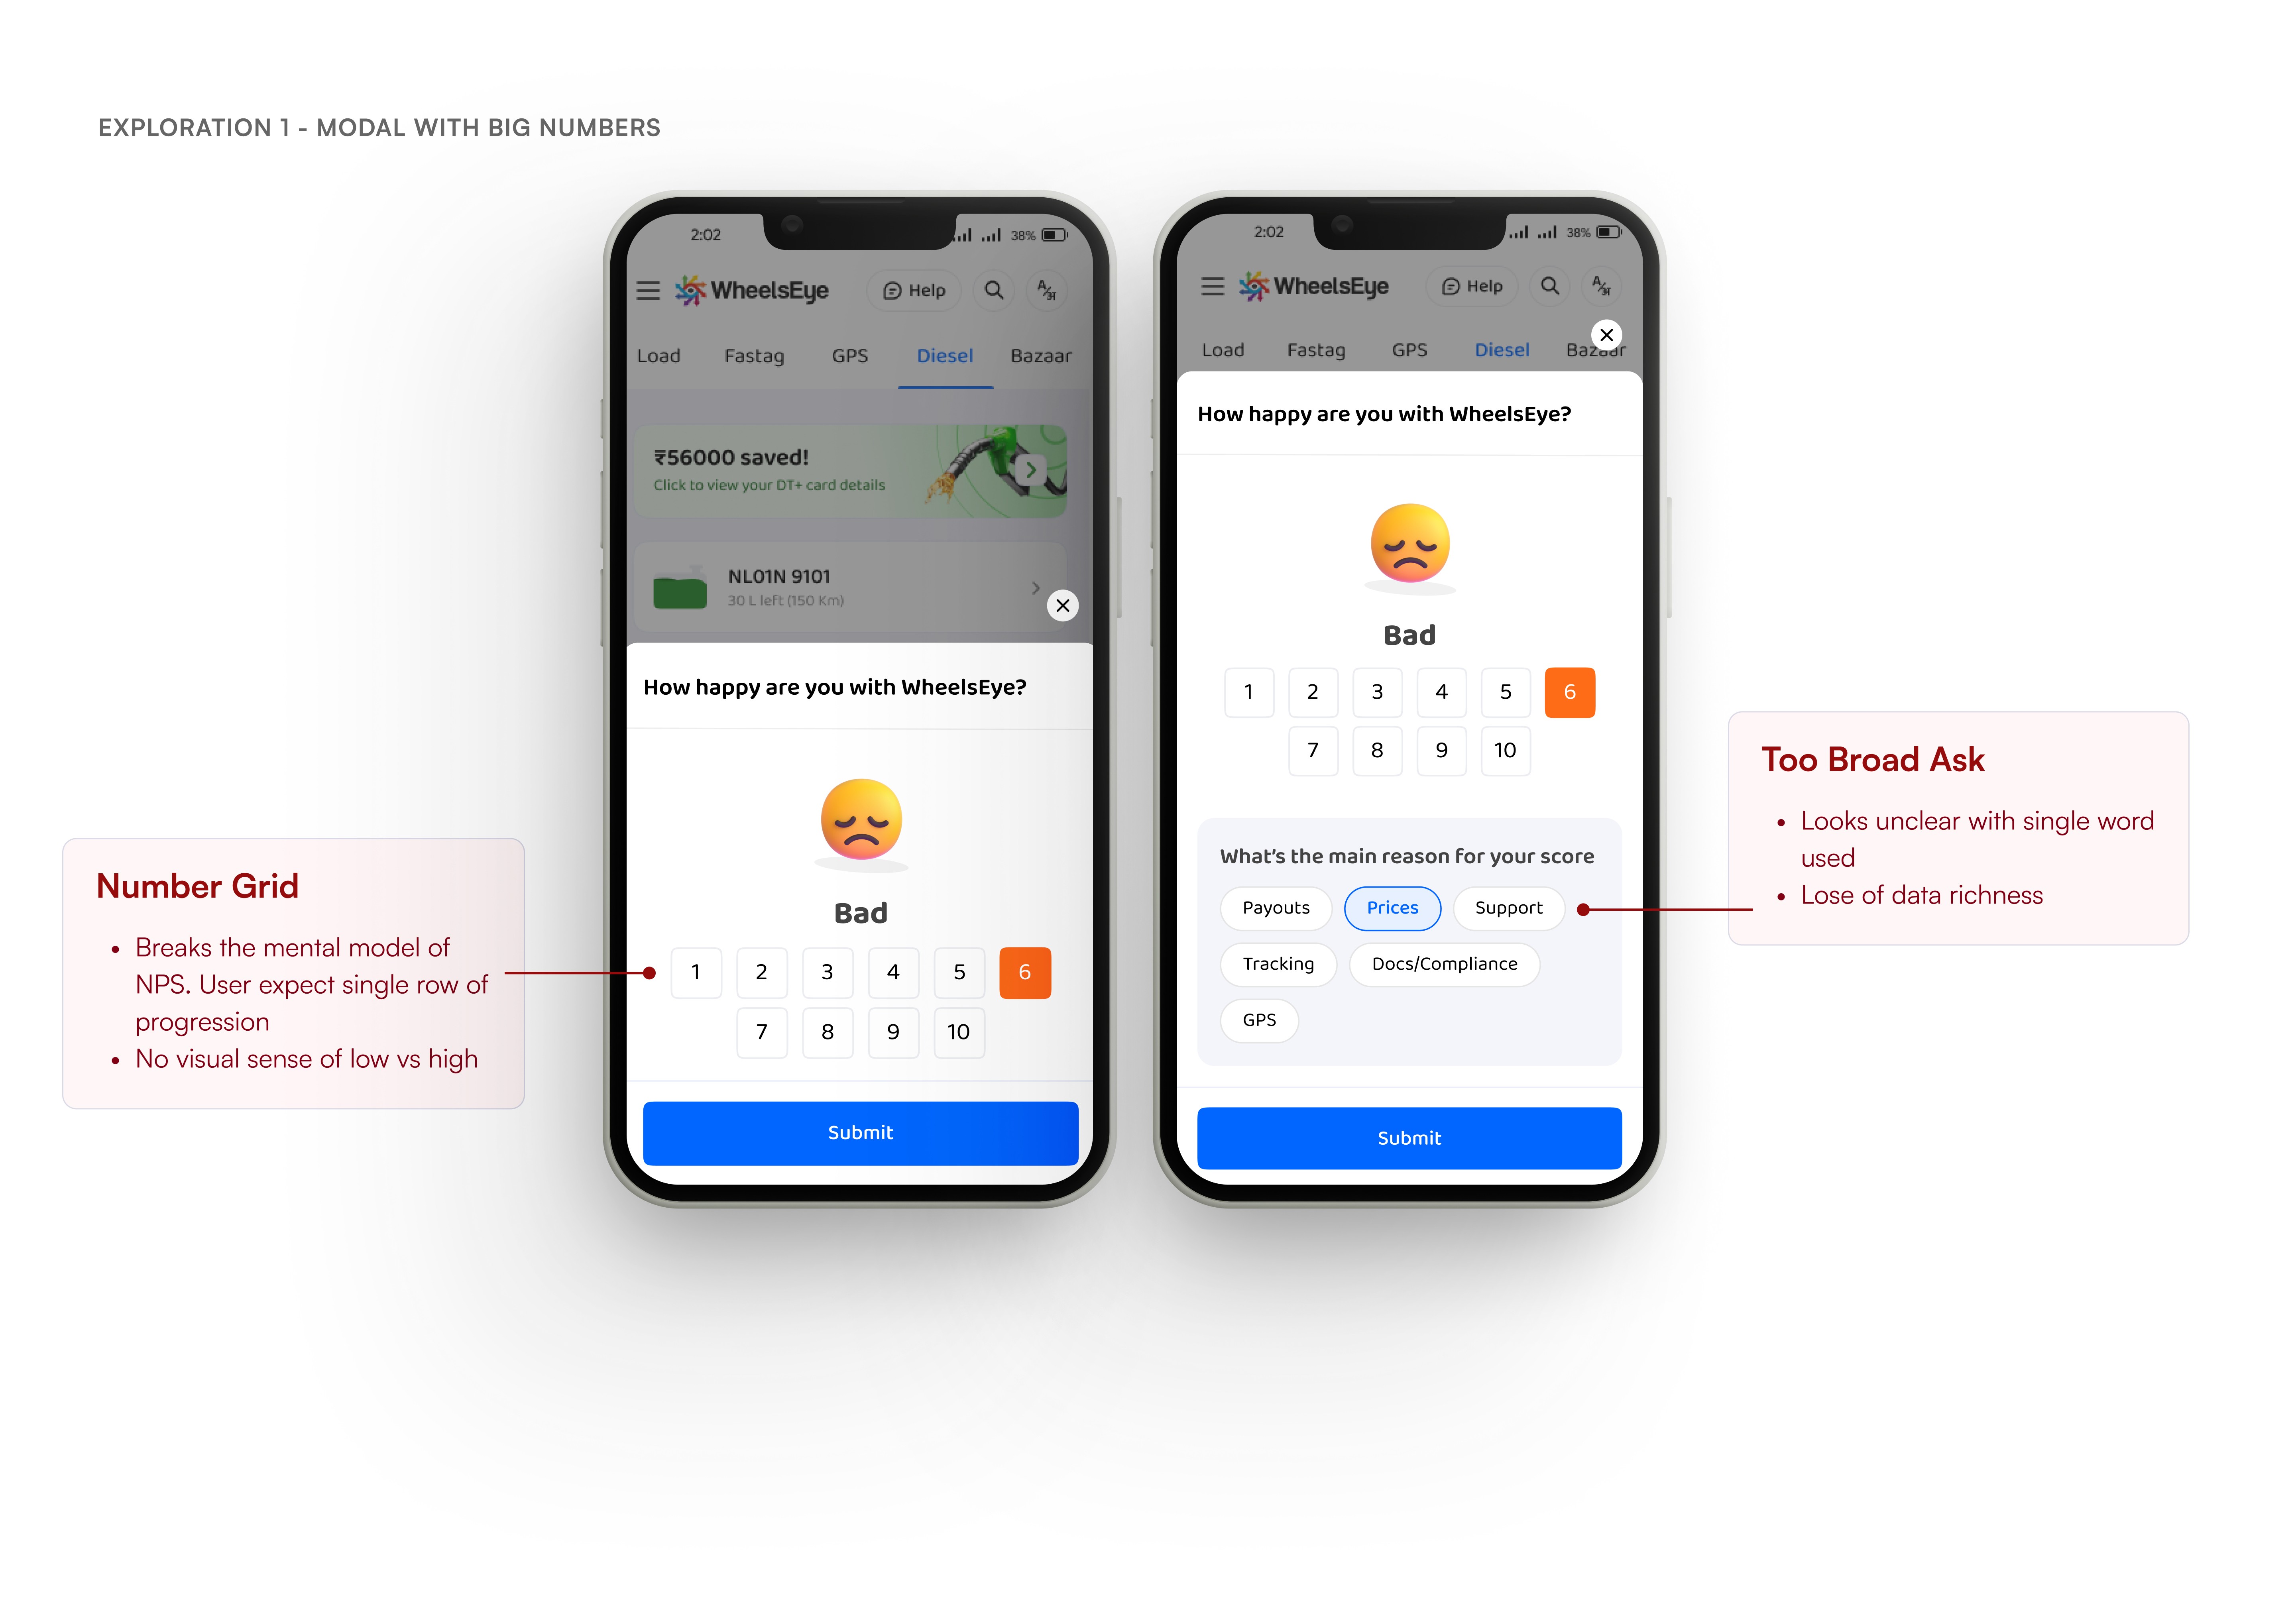
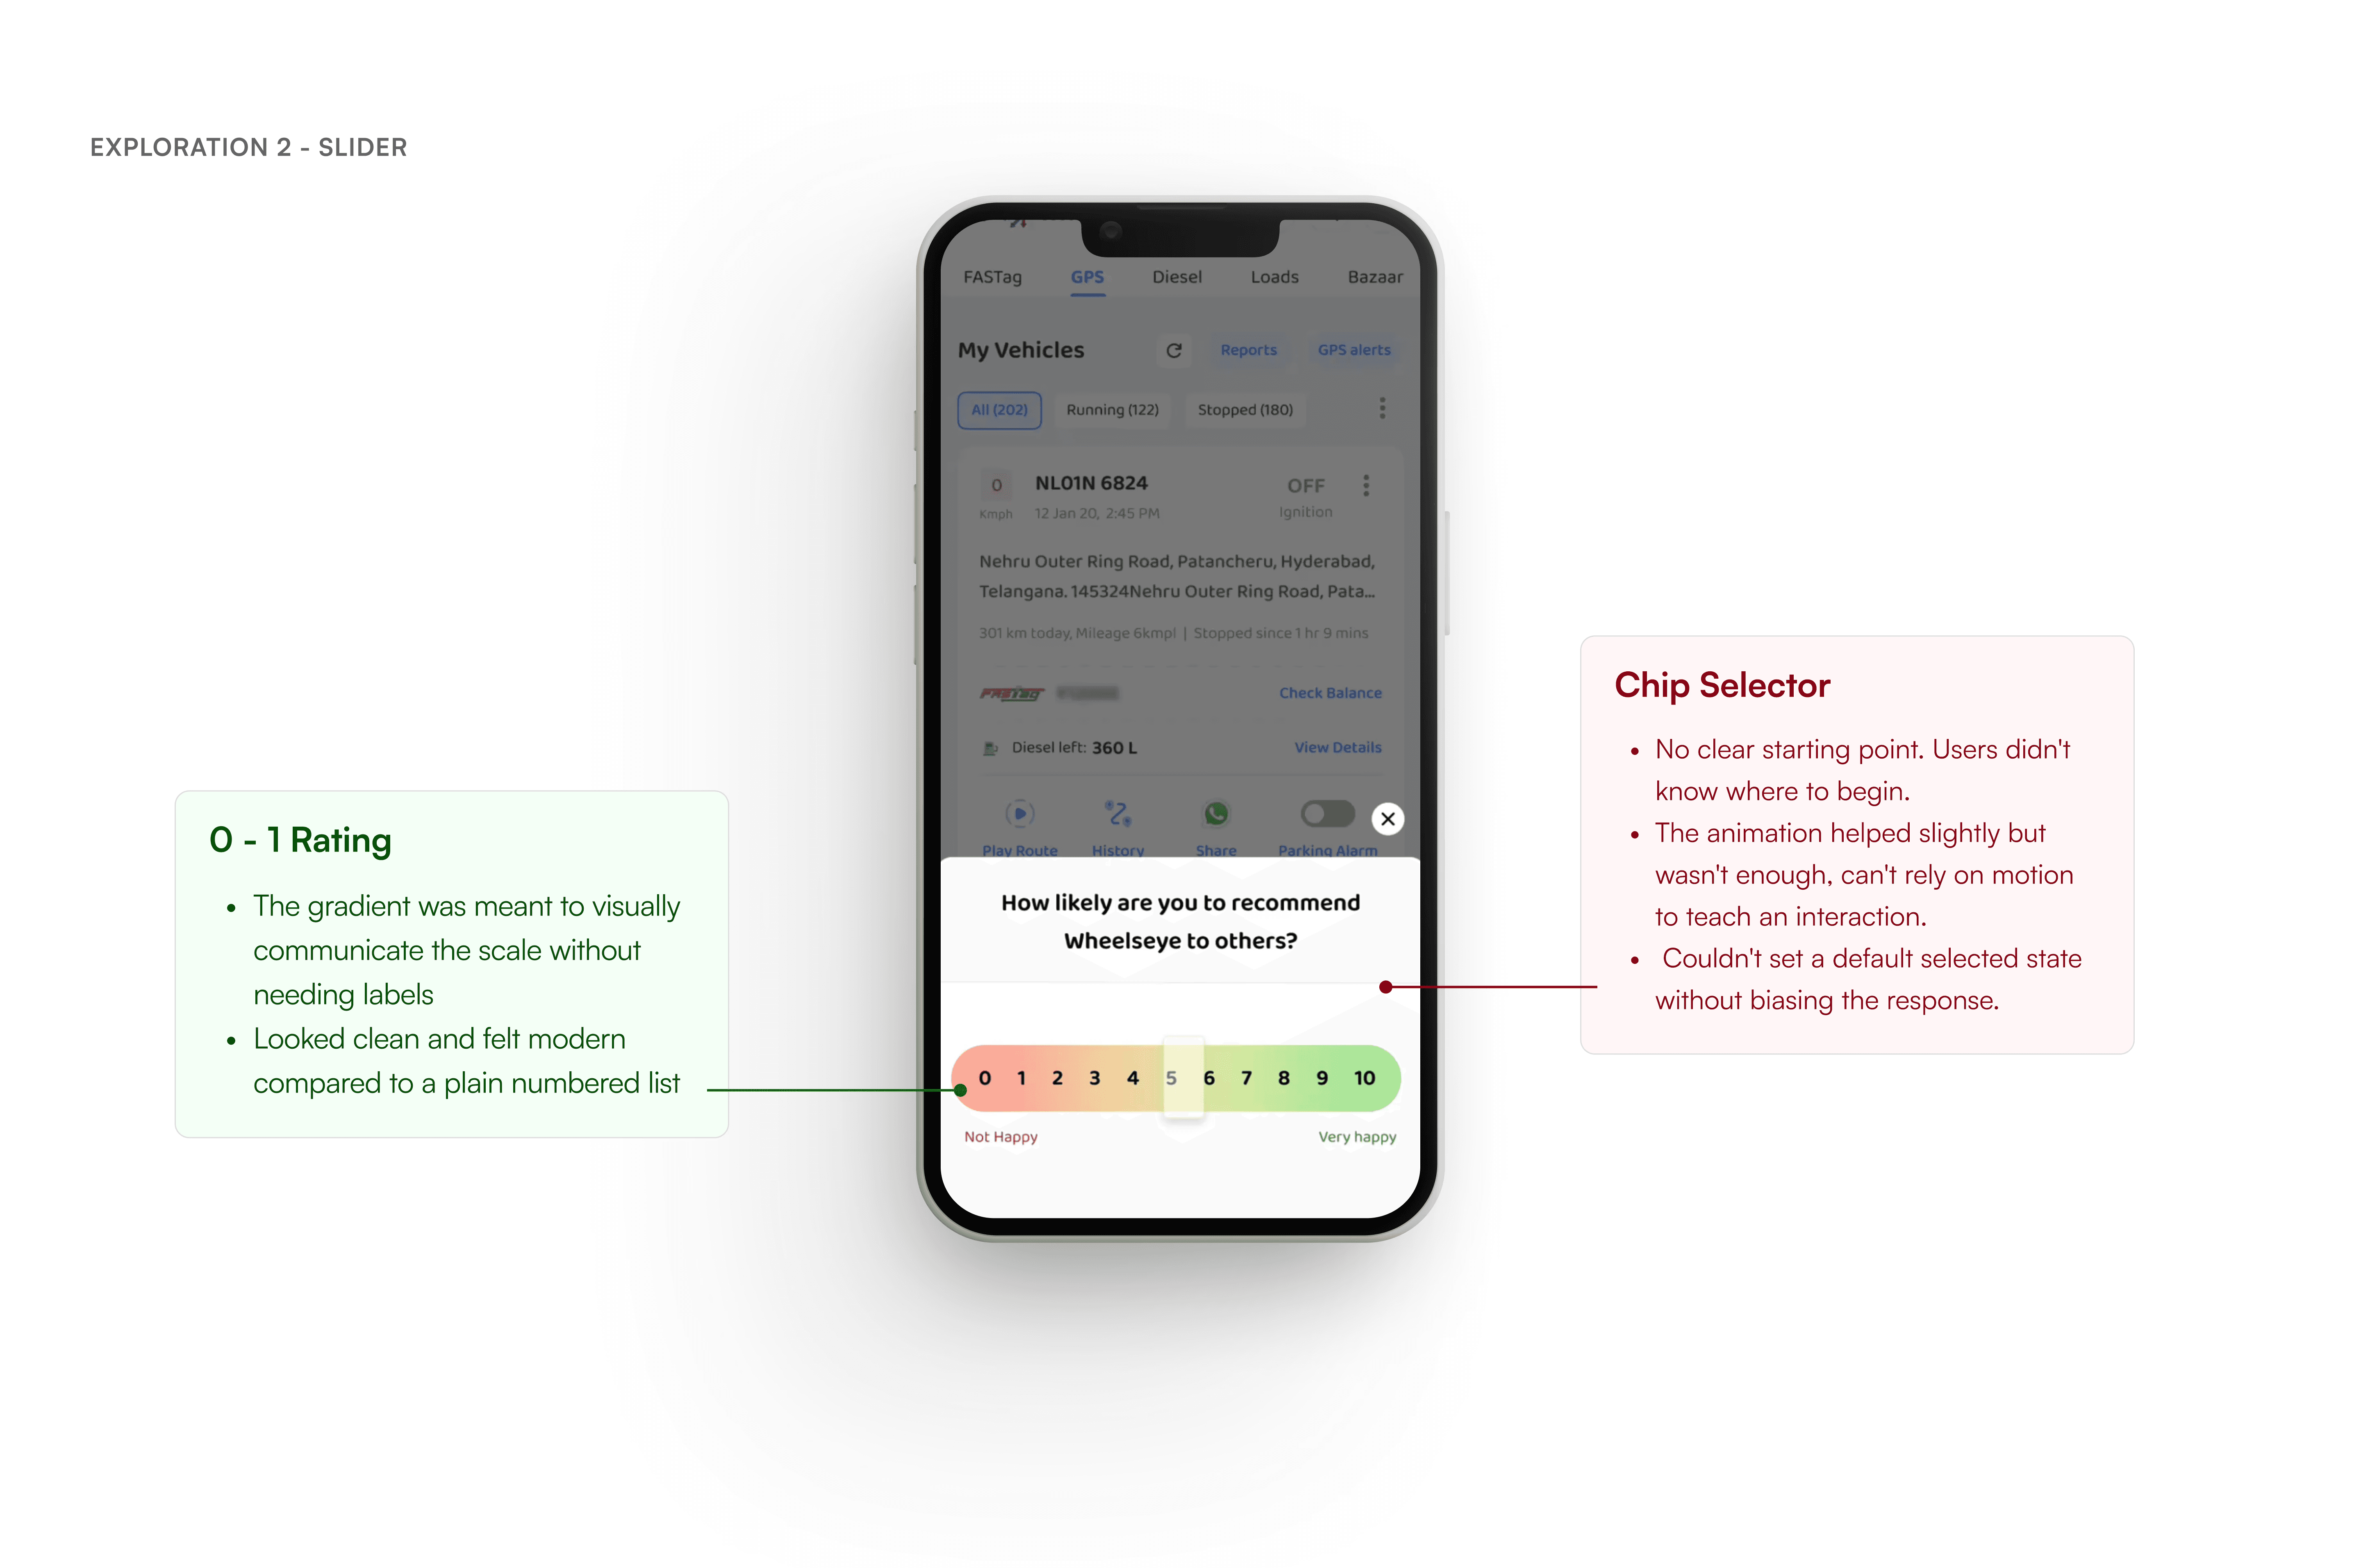
The rating input was the first thing we explored in depth. Getting users to pick a number between 1 and 10 sounds simple but the interaction design around it matters a lot, especially for a user base that isn't always highly tech-savvy.
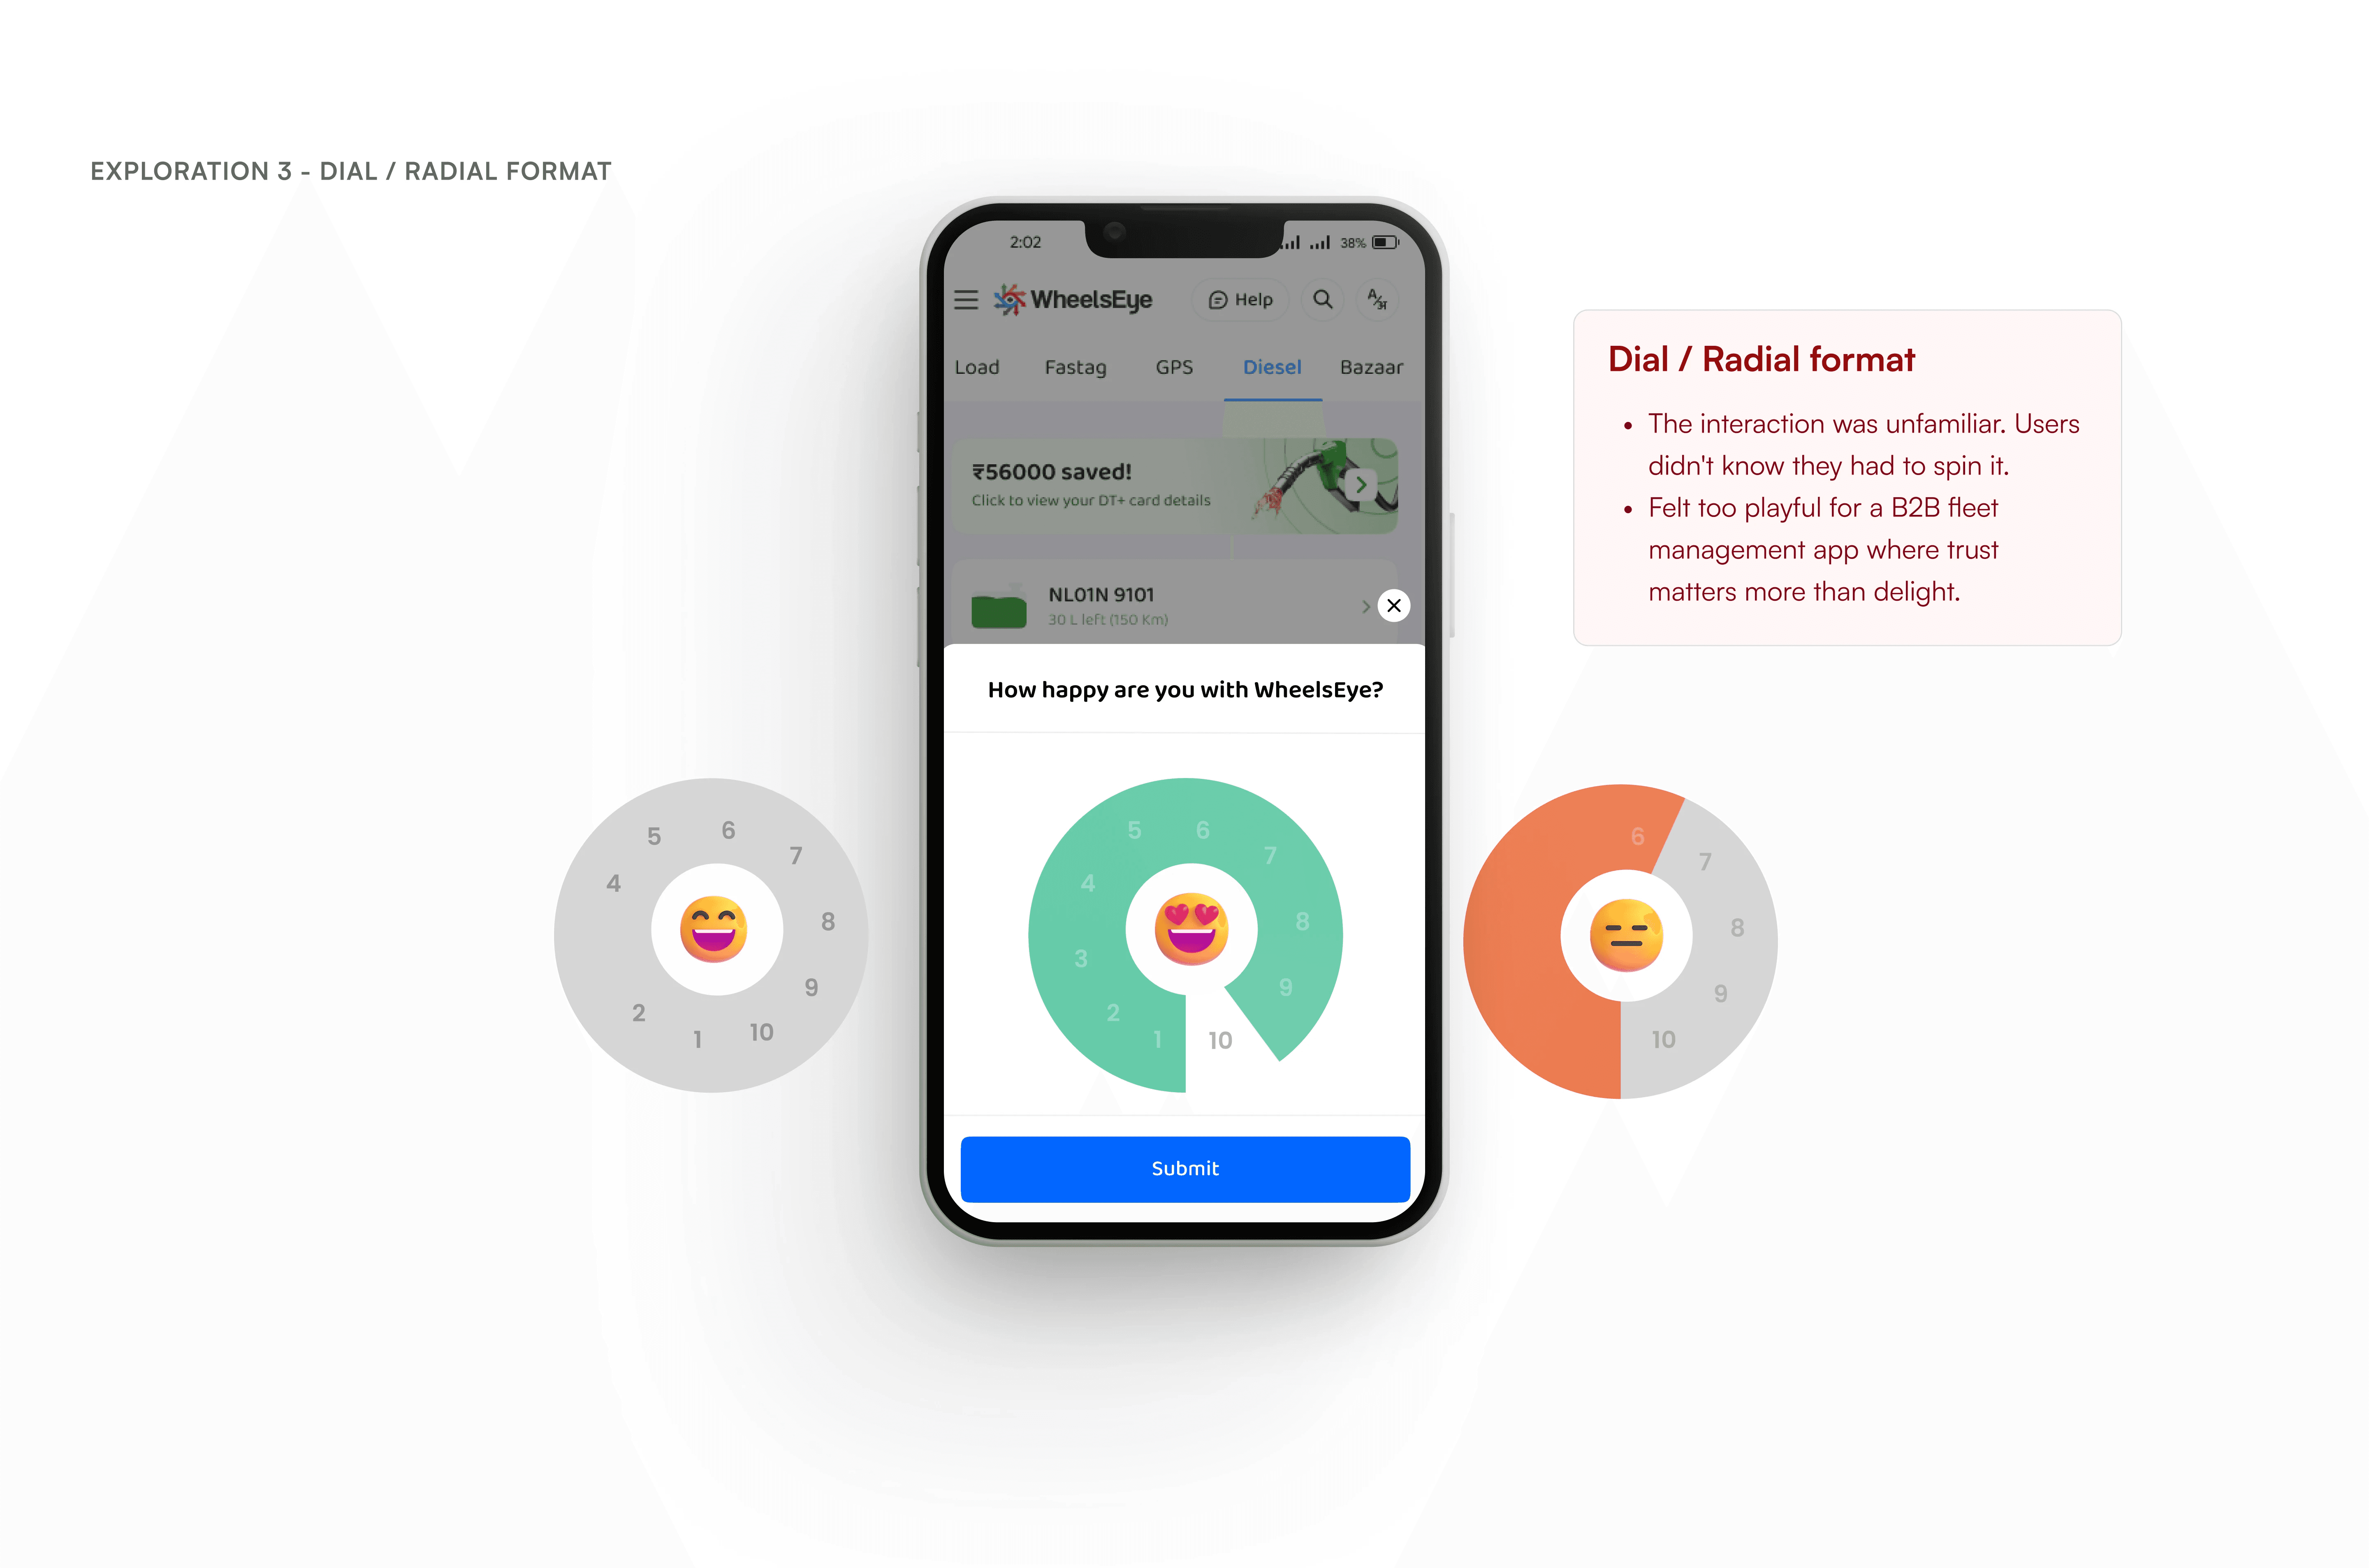
Final Design
The standard 1–10 linear scale won because users already understand it. It has no learning curve, works the same way across all 4 products, and doesn't require a default selection.
Key Decisions taken
1
Bottom drawer, not a modal
The survey appears in a bottom drawer: non-blocking, dismissible, anchored to the user's current context. A modal would have interrupted whatever the user was doing.
2
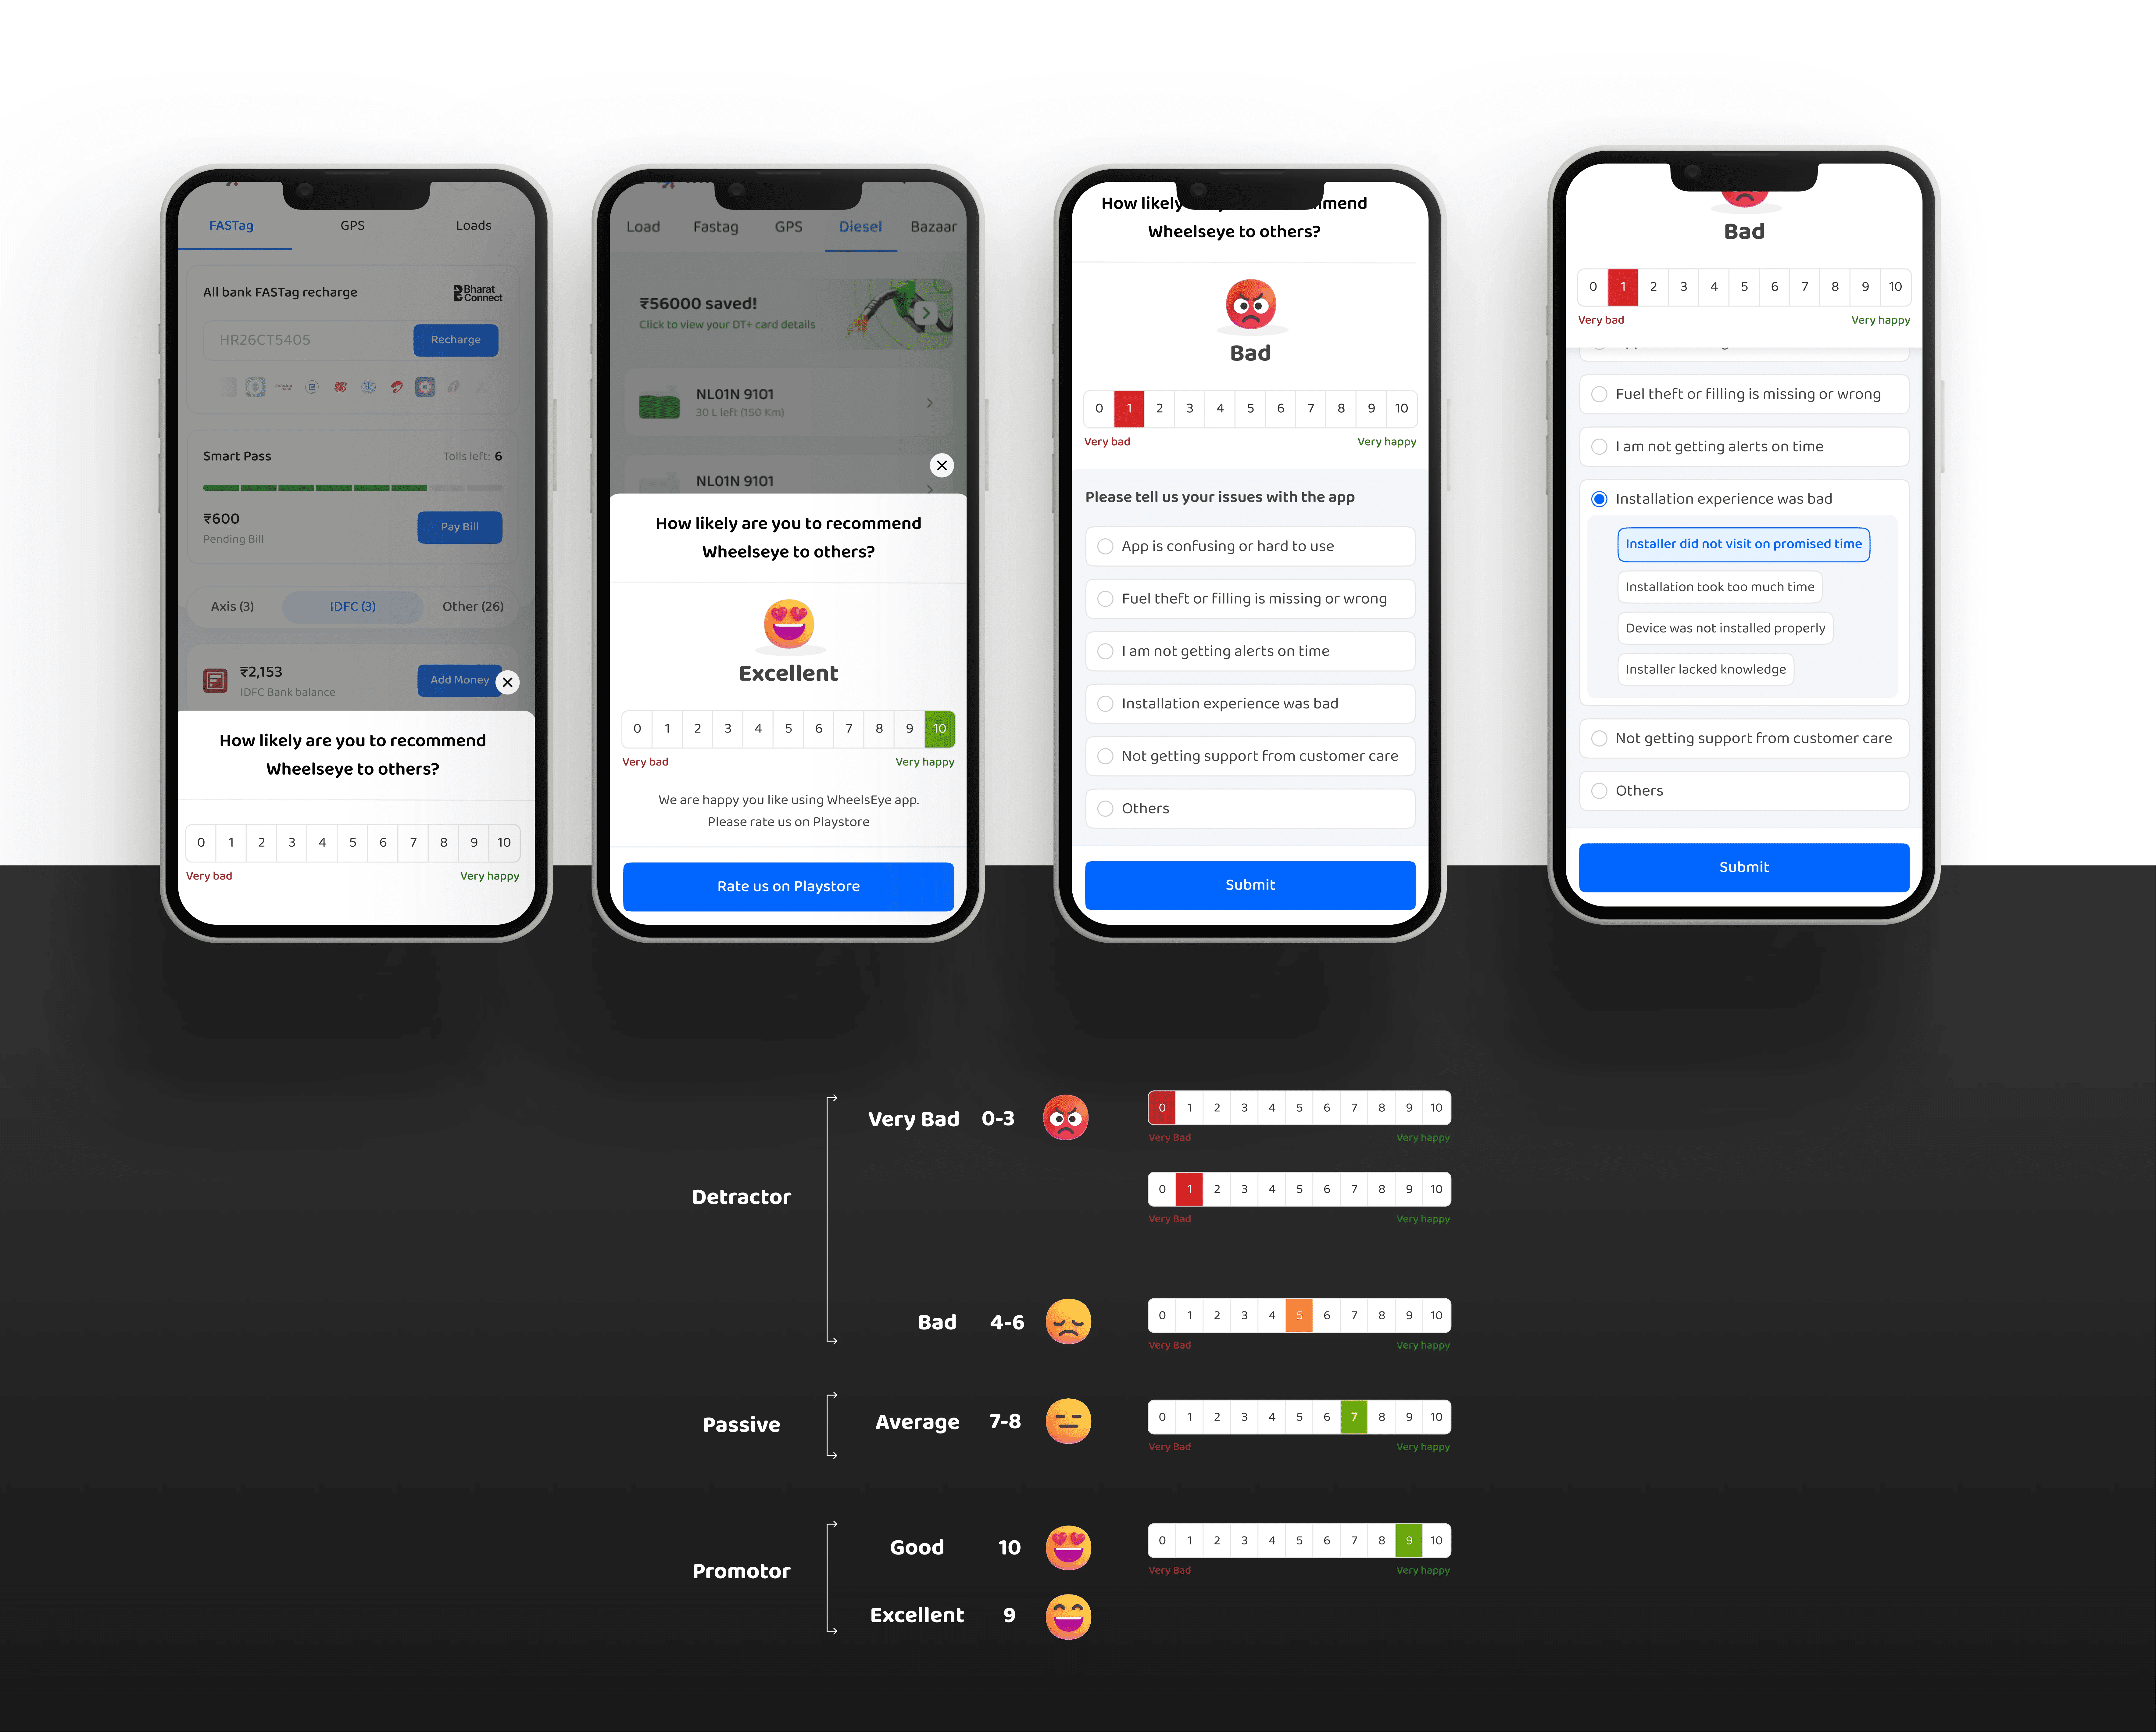
Emoji on the rating scale
Many fleet operators are not high-literacy users. A plain 0–10 scale can be confusing. Adding emoji at key points on the scale made it immediately clear what each end meant. Less thinking, faster response.
3
Different follow-up for each score
Based on what score a user picks, they see different options next. Detractors got specific problem categories. Passives got improvement suggestions. Promoters were redirected to the Play Store.
4
Two level drill-down for installation complaints
If a new user picked "installation issue," a follow-up question appeared asking what specifically went wrong. This gave the ops team actionable, categorised signal instead of a vague flag.
5
Triggers at high-intent moments only
The survey only appears when a user is actively doing something. This made responses more relevant because users were engaged when they answered.

IMPACT
What changed
• Beyond the NPS number, the more meaningful outcome was structural.
• For the first time Product, CX and Leadership had a single source of truth for user sentiment. Which was broken down by - product (GPS,DS,FT) and by user tenure
• The revised NPS feedback asked resonated more now as they matched what users were actually going through.